Marketplace Dashboard Overview
🔍 How to Access the Dashboard
You can access the Dashboard in two ways:
-
Click Dashboard in the top menu bar
-
Or click the SellerLegend logo in the top-left corner of any screen
🧭 What Does the Dashboard Show?
The Marketplace Dashboard offers a centralized view of your account’s performance:
-
Displays key metrics for either a single marketplace or an Account Group
-
Shows data in the native currency of the selected marketplace or group
-
Lets you monitor performance over a custom date range
You can learn how to create and manage Account Groups here.
To switch between Marketplaces or Groups, use the Marketplace Selector in the top-left of the screen. Learn more about switching marketplaces here.
📈 Key Performance Tiles
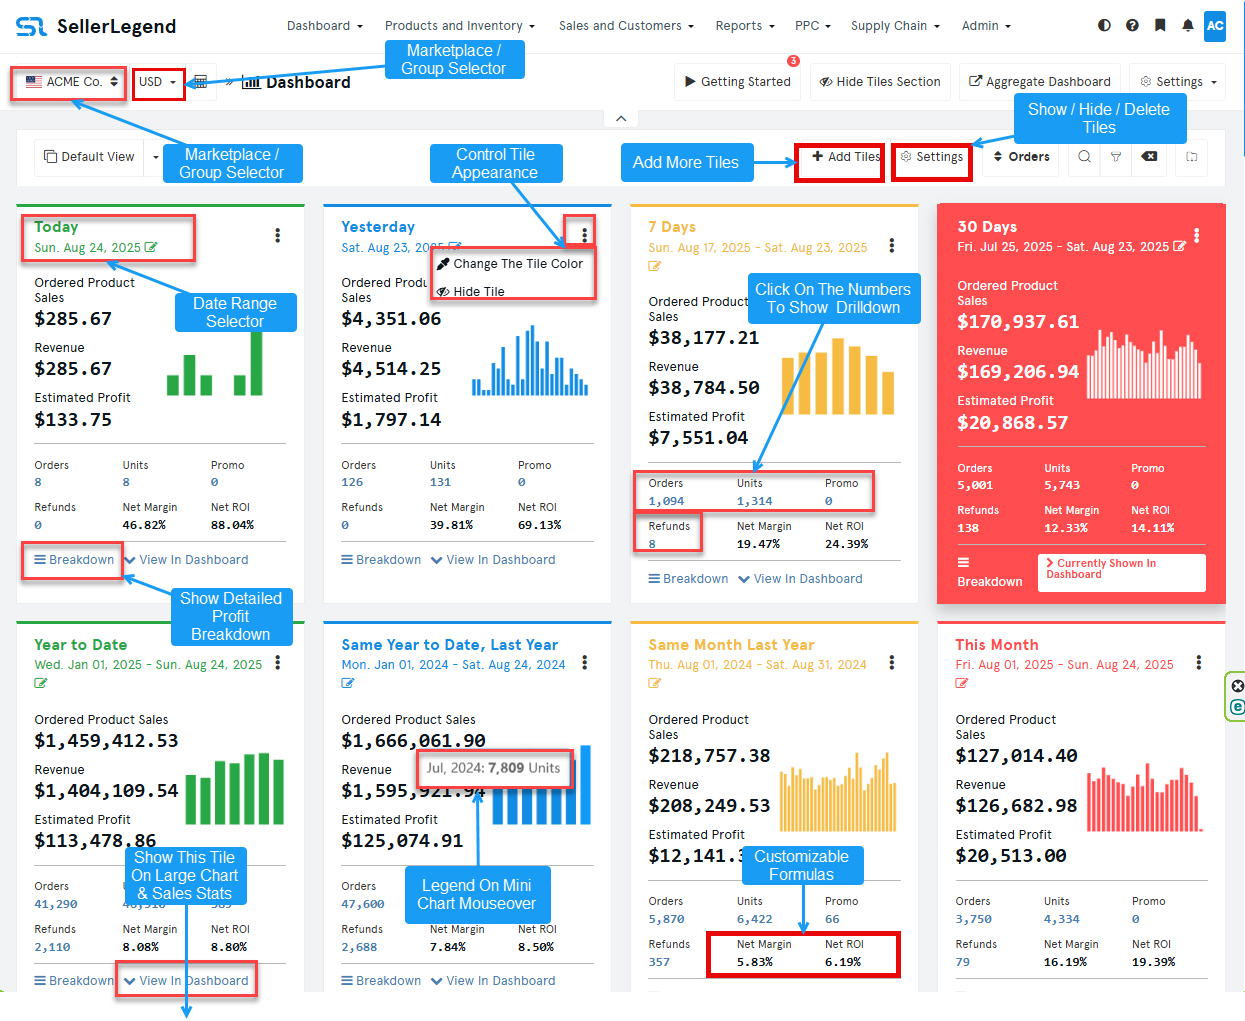
At the top of the Dashboard are four configurable tiles (expandable to more):
-
Each tile displays metrics over a custom date range
-
Click “View in Dashboard” to sync the chart and stats below to that tile’s range
-
Click the date in the top-left of the tile to change the reporting period
-
Use the three dots in the top-right to:
-
Change the tile color
-
Hide or show the tile
-
Access the Profit Breakdown
-
📊 Sales History Chart
This stacked bar chart summarizes daily performance for the selected date range:
-
Revenue Bars: Stacked by Promo Sales and Non-Promo Sales
-
Cost Bars (inside revenue bars): Show COGS, PPC, Fees, Taxes, and other expenses
-
Profit = Revenue bar height minus cost components inside
📌 Features:
-
Hovering shows a dynamic legend with daily breakdowns:
-
Revenue (promo + non-promo)
-
Costs (COGS, Fees, PPC, etc.)
-
Units (orders, refunds, promo units, etc.)
-
-
Use the legend to:
-
Show/hide data series
-
Change colors
-
-
Download the chart or underlying data using the transparent download button at the top-right
📊 Chart Filters (Tabs)
Use the chart filters to focus on specific performance dimensions:
| Filter | Focus |
|---|---|
| All (Default) | Revenue, PPC, Costs, Units – complete business overview |
| Revenue | Daily sales revenue only (gross, before fees/costs) |
| Notes | Shows manual annotations (e.g., promos, restocks) |
| PPC | Daily Amazon advertising spend |
| Costs | Total daily costs (COGS, Fees, Taxes, PPC, etc.) |
| Units | Number of units sold daily |
| Performance | Conversion Rate, Sessions, CTR |
Hovering over the chart updates the legend on the right with daily values.
📦 Product Statistics Tab
Provides a detailed breakdown by product, sorted by number of orders:
Key Columns:
Sales & Orders
-
Orders, Units, Refunds, Refund %, Promo Units, Non-Promo Units
-
Ordered Product Sales, Per Unit Revenue
Revenue & Costs
-
Revenue, Fees, Commissions, Promo Amount, Taxes, COGS
-
Shipping Cost, Miscellaneous Cost, Other Operational Expenses (OOE)
Traffic & Visibility
-
Sessions, Page Views
Advertising (PPC)
-
PPC Orders, Impressions, Clicks, Cost, Sales, TACOS, Conversion Rate
Profitability
-
Net Profit, Net Margin, Net ROI
🌍 Marketplace Selector
-
Appears only if you have multiple accounts or groups
-
Use it to switch dashboards between Marketplaces or Account Groups
📊 Dashboard Widgets
Each widget gives you specific insights into your business. Here’s a brief of each:
🛍 Top 10 Best Sellers
-
Bar chart of top-selling products for the selected date range
-
Hover to see SKU, ASIN, Revenue, Units, Profit
-
Link to Sales Statistics
📈 Products with Positive/Negative Trends
-
Compares current vs previous period performance
-
Green = previous; Yellow = current
-
Shows SKU, Revenue, Profit, Net ROI, etc.
-
Links to Sales Statistics
🔄 Repeating vs One-Time Customers
-
Pie chart showing customer loyalty split
-
Click to view customer list
-
Covers all orders since onboarding (not filtered by date range)
👥 Customer Segmentation
-
Pie chart based on your defined customer segments
-
Initially shows 100% unsegmented
-
Learn how to set segmentation rules
🌎 Relative Performance by Marketplace
-
Pie chart comparing units sold across marketplaces
-
Hover for Revenue, Profit, Units
-
Shows all marketplaces, regardless of dashboard filters
💰 Operating Expenses
-
Table of expense types and values
-
Link to Incurred Expenses
📦 Products Widget
-
Shows total, active, buy box–holding, and inactive products
-
Link to Products List
-
Updates every 8 hours
-
Not affected by dashboard date range
🛒 Promotions Widget
-
Lists all promo codes used in orders
-
Editable “friendly name” support
-
Link to Orders screen
🧾 Account Valuation Widget
-
Estimates the cash, cost, and retail value of your inventory
-
Based on today’s values (not affected by date range)
-
Includes inventory across all marketplaces
📅 Upcoming Restocks
-
Shows products nearing stockout based on alert settings
-
Includes reorder date, quantity, and capital required
-
Link to Inventory Settings
🔄 Returns by Disposition
-
Pie chart breakdown of return reasons during the selected date range
-
Link to Returns
👁 Watchlist Summary
-
Lists watchlist reasons and number of customers tagged
-
Link to Customer Watchlist Reasons
❌ Cancelled Orders
-
Pie chart showing canceled vs total orders
-
Covers all historical orders (ignores dashboard date range)
📦 Long-Term Storage Fee Forecast (*)
-
Predicts upcoming Amazon LTSF charges
💸 Average Customer Cross-Sell / Lifetime Value (*)
-
Shows average revenue per customer over lifetime and cross-sell period