🚀 How To Get Here
From the main menu:
Products and Inventory → Products Dashboard
🎯 What Is It For?
The Products Dashboard allows you to monitor data for one selected product at a time.
-
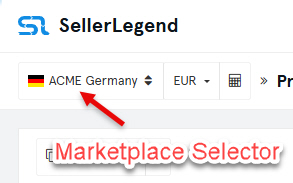
If you manage multiple Accounts/Marketplaces, a Marketplace Selector (top-left) lets you choose which Account/Marketplace to view.
-
View the overall health of a product at a glance.
-
Track all the important business KPIs for a product over a chosen date range.
💡 Hints & Tips
-
📌 Important details:
-
The chart does not include a bar for Today.
-
Tiles with future dates also exclude Today, since the day is incomplete unless it’s 11:59:59 PM.
-
A tile set to “30 days” means yesterday + 29 prior days.
-
-
🔄 From this screen, you can also jump directly to the Sponsored Product Dashboard for this product by clicking the PPC Dashboard button.
🖼️ Screen Description
The screen has four constituent parts. Each part will be detailed on further in this article.
📊1. Tiled KPI Boards
📈 2. Sales History Chart
- This will be shown when clicking the Chart button
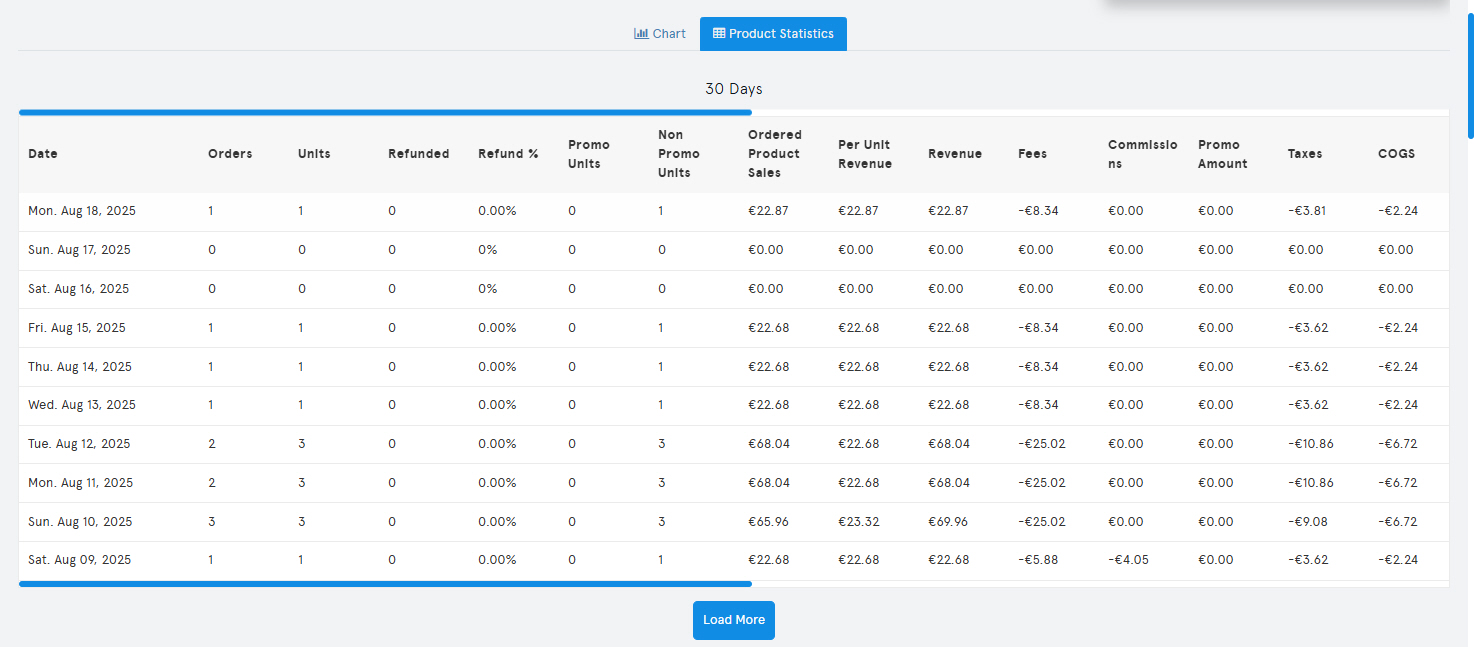
📋 3. Product Statistics Table
- This will be shown when clicking the Product Statistics button
🧩 4. Widgets
- A series of mini-screens with relevant product information for the selected product.
🧩 Content Breakdown
🌍 Marketplace Selector
-
Use this dropdown to select a Marketplace (click link for details).
-
Hidden if you only have one Marketplace.
- Once you have selected the marketplace, please proceed to select one product as described below.
🔎 Product Selector
Search for a product by typing:
-
ASIN
-
SKU
-
Internal Product Name
In the textbox, start typing any characters contained in any of the product’s identifiers above
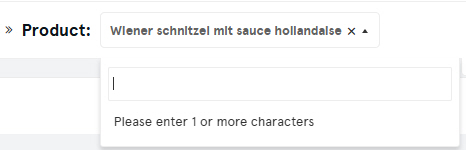
➡️ Returns all matches across those identifiers, saving you from scrolling through thousands of products (useful for RA sellers).
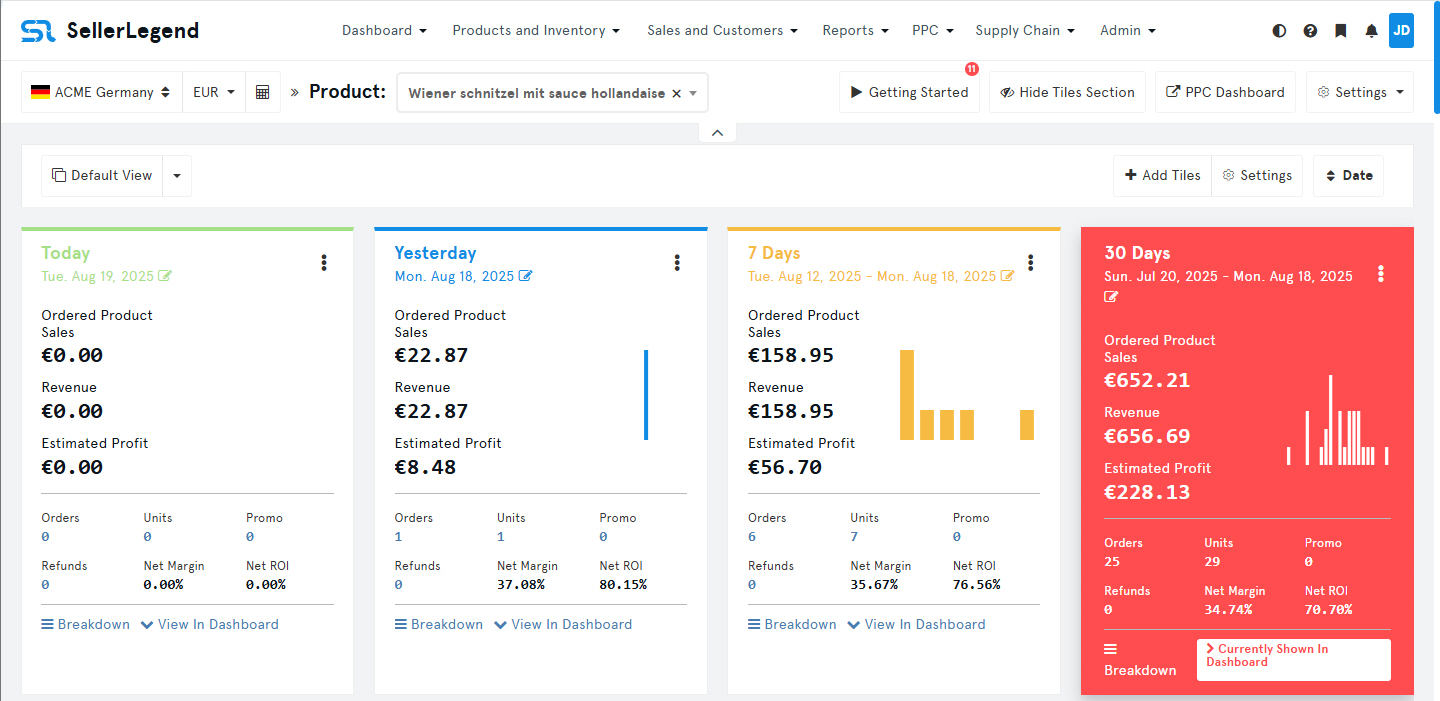
📐 Tiled KPI Boards (The Tiles)
-
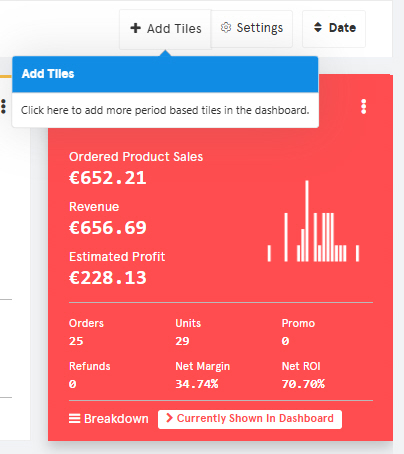
By default, four KPI tiles for high-level metrics are shown for the (arbitrary) time periods of Today, Yesterday, 7 Days and 30 Days.
- You can of course change those pre-set dates
Setting a date range to a tile
-
- Click on the tile’s date to set a new date range of your choice
-
Each tile can be set to its own timeframe.
-
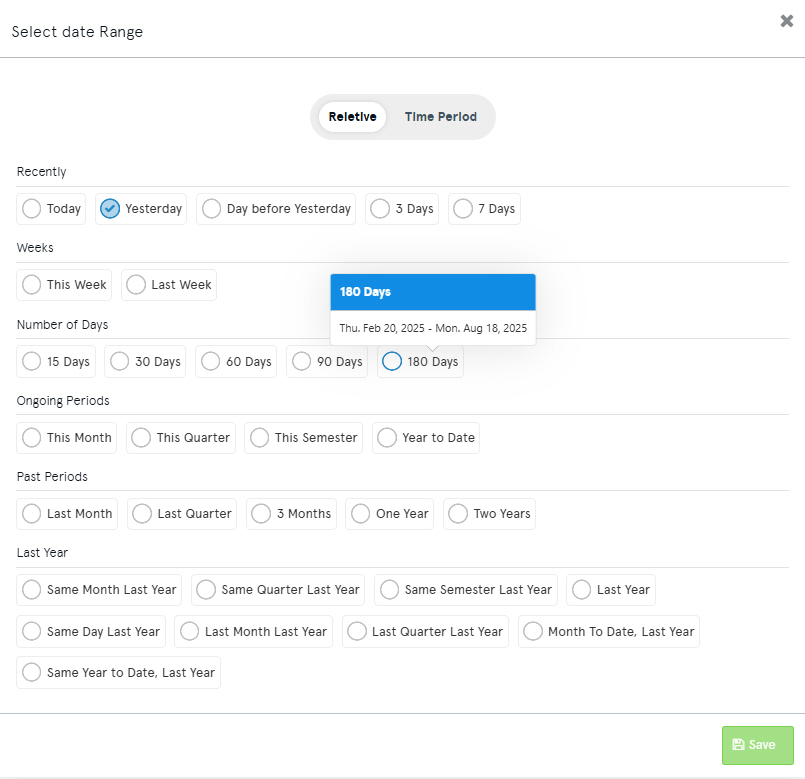
Date ranges available are as follows
- Either Time Period
- An absolute date range (e.g. 17 July 2023 to 26 of May 2025)
- Or Relative Data Ranges (e.g. Last Week, Same Month Last Year), as follows
- Notice how the Relative Dates date selector panel shows the actual absolute dates dates in a toot tip on hovering the relative date.
- Either Time Period
Adding Tiles
-
- Click on the + Add Tiles button
- Select the date range for the tile
- Click on + Add New Tile
Deleting Tiles
-
- Click on Settings (to the right of +Add Tiles)
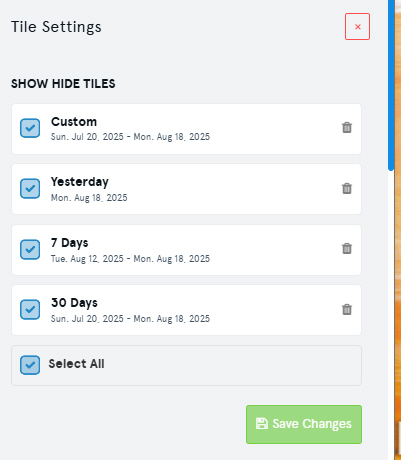
-
- In the SHOW/HIDE TILES Panel
- Click on the bin next to the tile you want to delete
- Click on the Save Changes button
Changing Tile Colors
-
- Click on the Kebab menu to the top right of the tile
- Click on the Eye Dropper, use the color palette to select the color of your choice
- Click on Select and the tile will adopt the chosen color
-
Projecting The Tile Date Range And KPIs To The Dashboard
- You can expand the details of a tile to either the Chart View or the Product Statistics Table View
- In the tile of your choice, click on the “View In Dashboard” text link
- This will
- Expand the KPIs of the tile to be shown in the Dashboard area.
- Color the body of the tile with the tile-assigned color, to highlight that the selected tile is now projected on the dashboard.
- Change the text link in the selected tile from “View in Dashboard” to “Currently Shown in Dashboard”.
- Whitewash the previously projected tile, just leaving a top line in the tile’s assigned color.
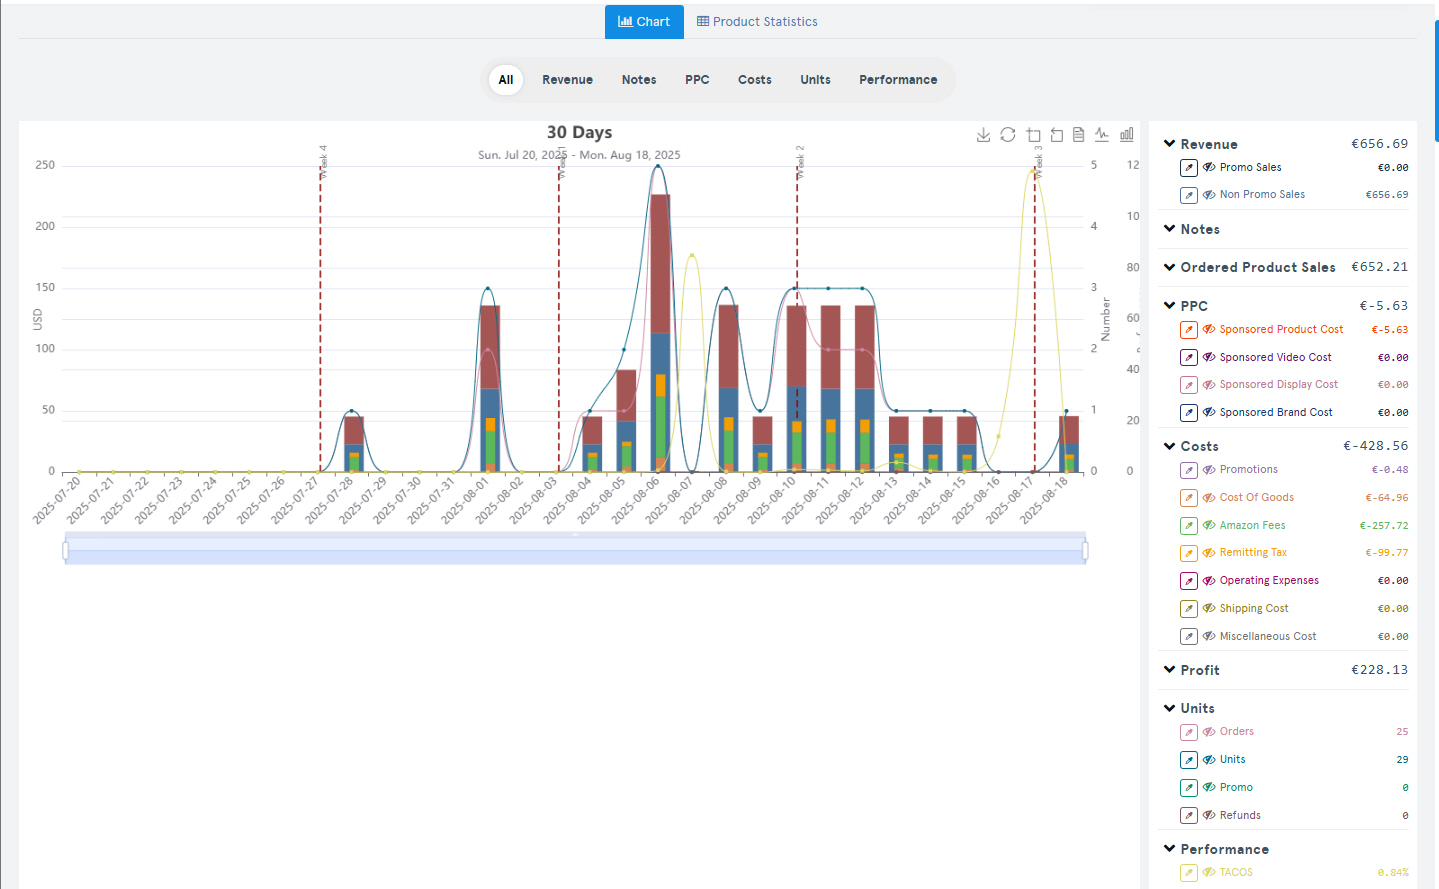
📈 Sales History Chart
Shown when clicking on the Chart Button below the tiles
-
Stacked bar chart showing the date range defined by the the currently projected tile.
-
Legend is dynamic → hover over a bar to see daily data.
-
Each bar = one day, showing:
Revenue (stacked)
-
Promo Sales Revenue
-
Non-Promo Sales Revenue
Costs (stacked inside Revenue)
-
Promotions (discounts given away)
-
COGS (zero until defined)
-
Amazon Fees (Fulfillment + Referral, excludes Non-Order fees like storage/transport)
-
Taxes (currently EU VAT only)
-
PPC Costs (initially zero until PPC data accumulates)
-
OOE (Operating Expenses, initially zero until configured)
Units
-
Orders received
-
Non-Promo Units sold
-
Promo Units sold
-
Refunds
📌 Profit = Revenue bar minus embedded Cost stack.
🎛️ You can toggle data series on/off via chart legend.
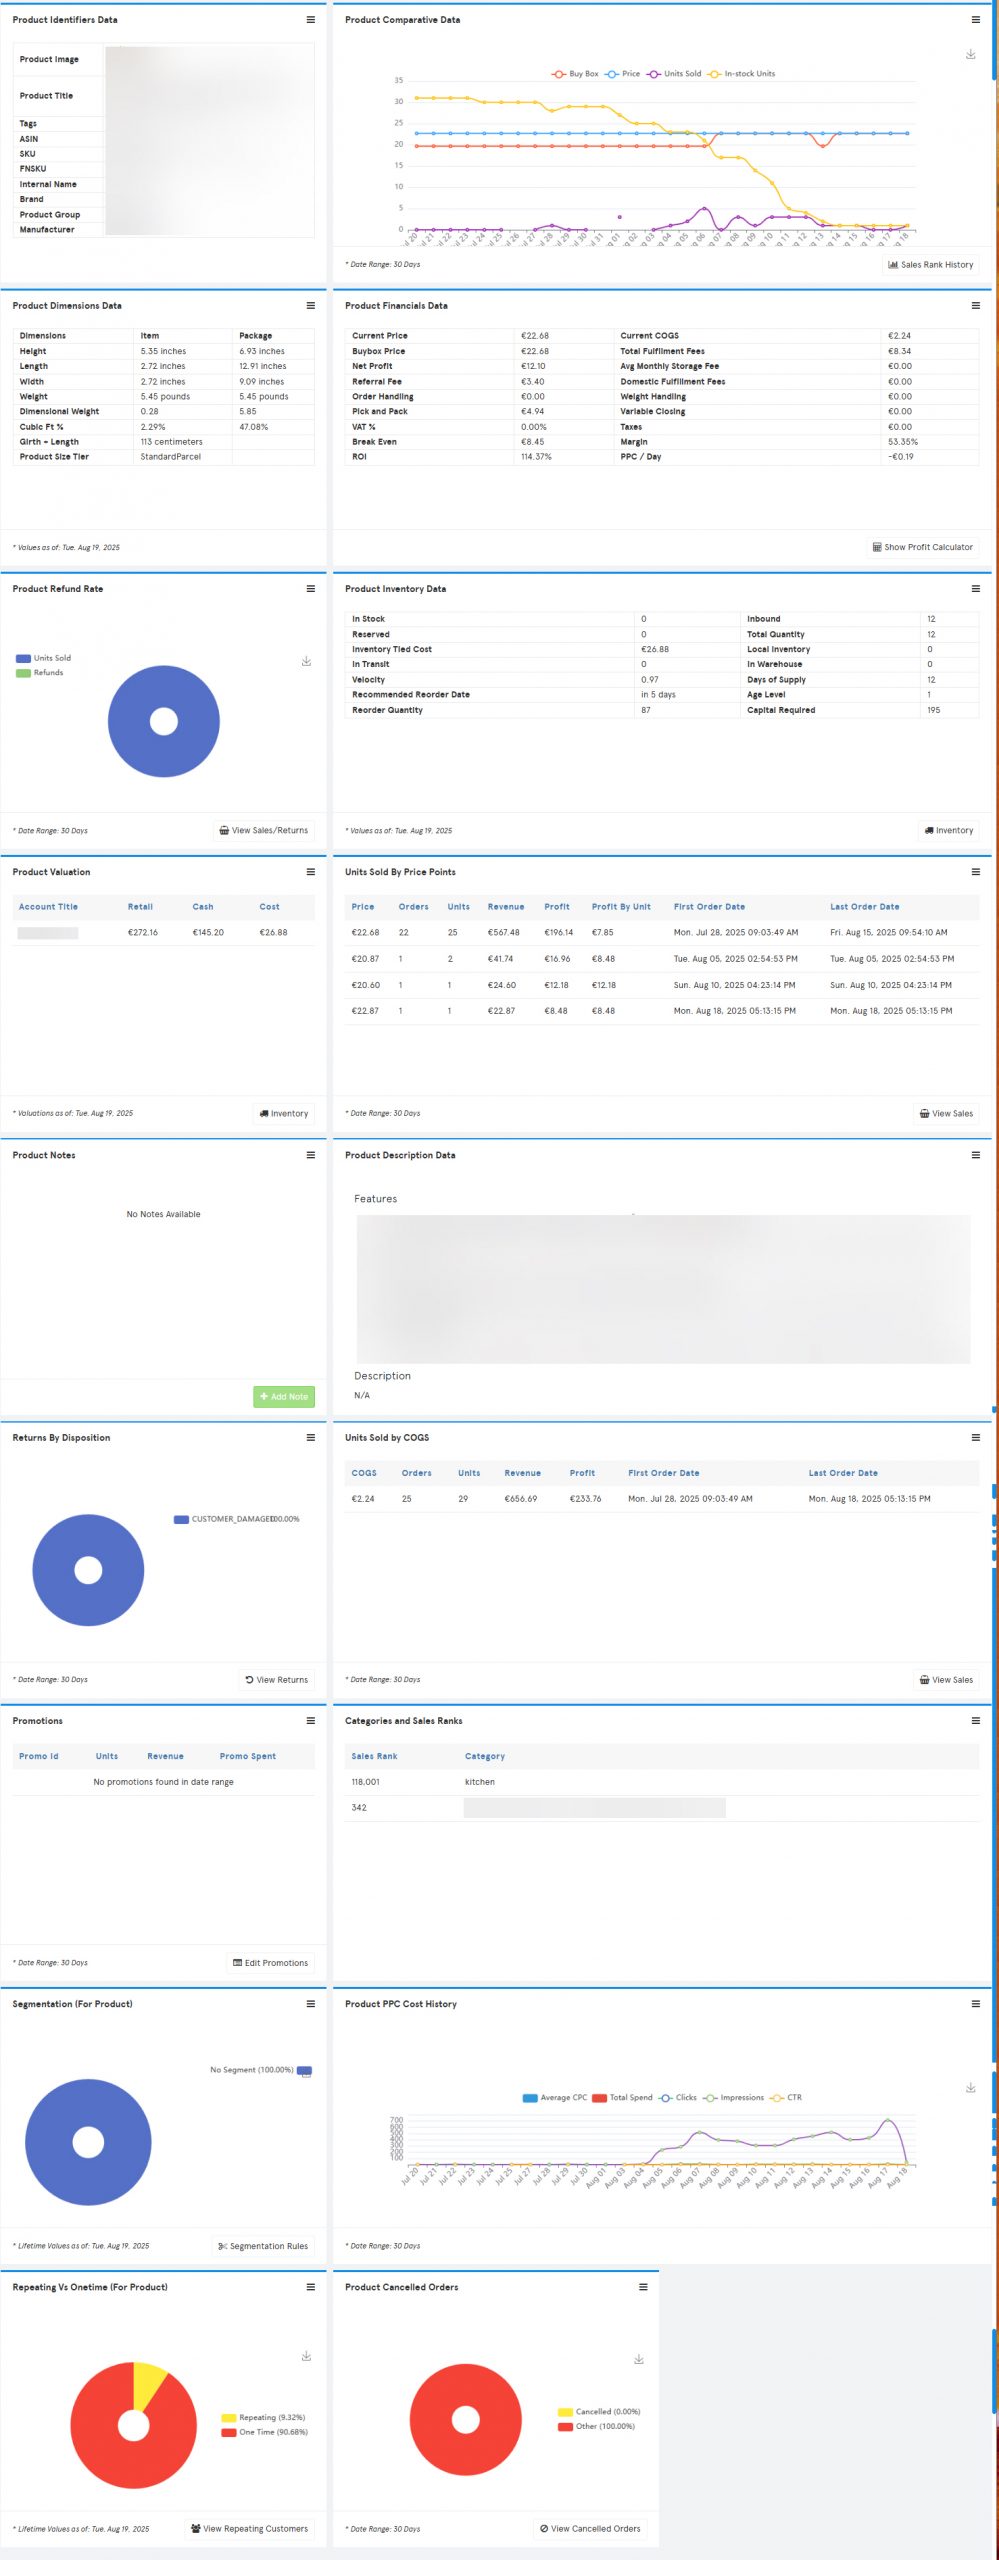
🆔 Product Identifiers Widget
Displays product metadata:
-
Title, ASIN, SKU, FNSKU
-
Internal Name, Manufacturer, Brand
-
Product Group, Tags
📊 Product Comparative Data Widget
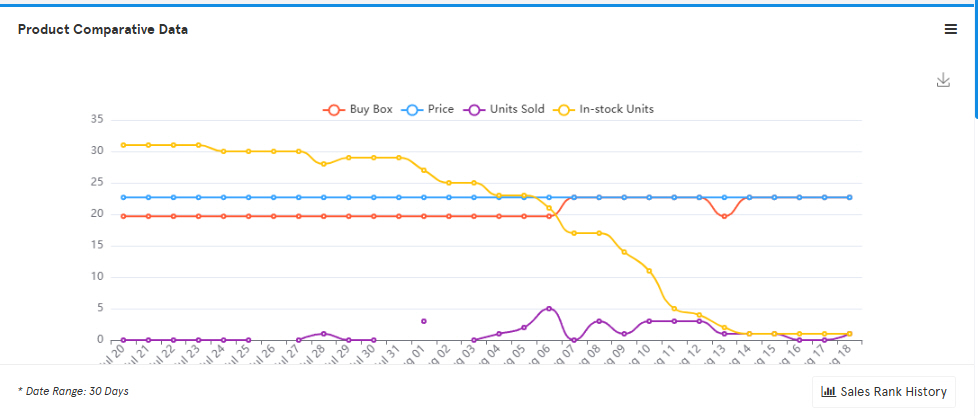
Plots:
-
Units Sold
-
Price History
-
Sales Rank (lower = better)
-
Buy Box %
⚠️ After onboarding, only Units Sold is populated. Price history, BSR, and Buy Box are collected going forward (not retrospectively).
📦 Product Dimensions Widget
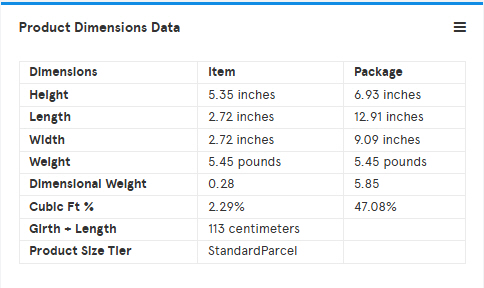
Useful for shipping cost calculations:
-
Height, Length, Width
-
Dimensional Weight ((L×W×H) ÷ 139)
-
Cubic Ft % (((L×W×H) ÷ 1728) × 100)
-
Girth + Length
-
Size Tier
🔄 Refund Rate Widget
-
Pie chart: % Refunded vs % Not Refunded.
-
Hover shows actual unit counts.
💰 Product Financials Widget
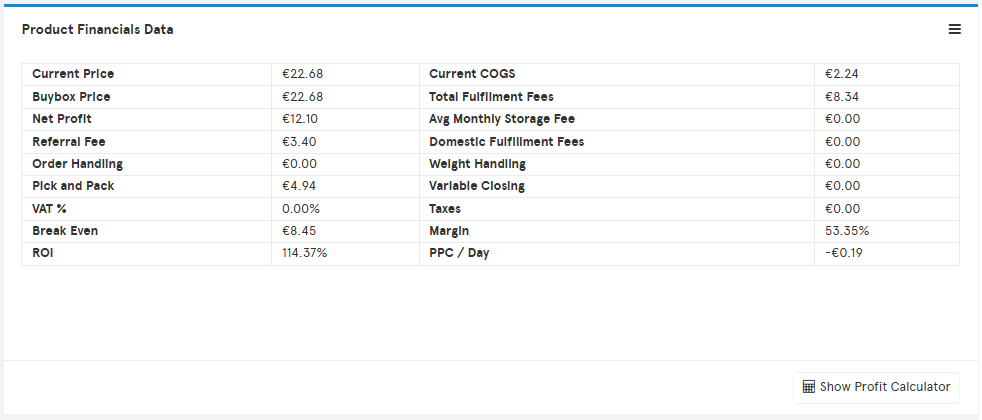
Displays raw financial values:
-
Current Price
-
Current COGS
-
Fulfillment Fees (Referral + Pick & Pack + Weight Handling + Order Handling)
-
Net Profit
-
Avg Daily Storage Fee (storage ÷ days)
-
Break Even Price
-
Margin %
-
ROI %
-
Avg PPC/day
⚠️ Notes:
-
Right after onboarding, values show N/A until COGS and VAT are defined.
-
Fee info is from Amazon Selling Partner API → may be inaccurate or missing.
-
Fee context (e.g. Small & Light) may not be reflected.
Formulae used:
-
Referral Fee = Referral % × Price
-
FBA Fee = Other FBA Fees + Referral Fee
-
Costs = COGS + FBA Fee
-
Break Even = (Costs – Referral Fee) ÷ (1 – Referral %)
-
Net Profit = Price – Costs
-
Margin % = (Net Profit ÷ Price) × 100
-
ROI % = (Net Profit ÷ (COGS + FBA Fee)) × 100
📑 Units Sold by Price Points Widget
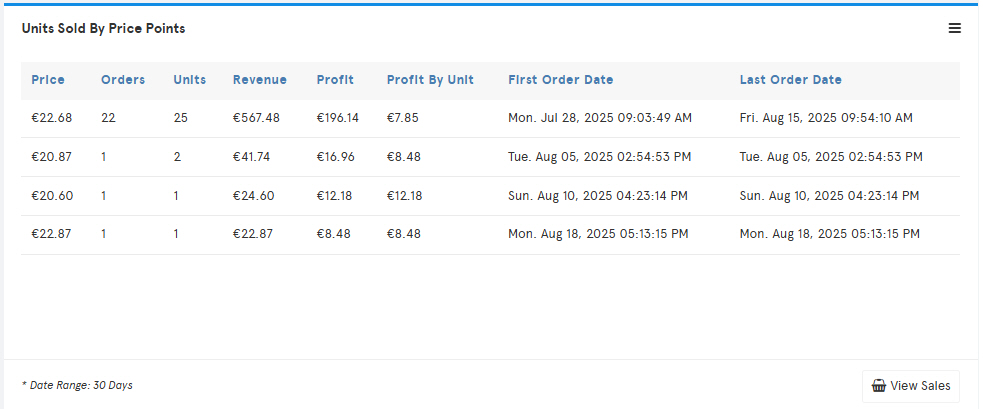
Table shows:
-
Price, Orders, Units, Revenue, Profit, Avg Profit/Unit
-
First & Last Order Date
➡️ Sorted by highest units sold.
🧾 Units Sold by COGS Widget
Table shows:
-
COGS Amount, Orders, Units, Revenue, Profit
-
First & Last Order Date for each COGS value
📢 PPC Cost History Widget
Plots over selected timeframe:
-
Impressions
-
Clicks
-
CTR
-
Avg CPC
-
Total Spend
⚠️ Empty right after onboarding (PPC data only accumulates going forward).
📝 Product Description Widget
Displays:
-
Product Bullets
-
Product Description
Combined into a single field for easy copy/paste.
🌐 Product Distribution by Marketplace Widget
Pie chart by marketplace. Hover shows:
-
Account Name
-
Units Sold
-
Revenue
-
Profit
🎟️ Promotions Widget
-
Lists all promo codes used in Orders for the product.
-
Shows count of uses per code.
-
Clicking a number opens the Orders screen with filtered results.
-
⚙️ Edit button → lets you hide/show promo codes or assign a friendly name.
🖼️ Listing History Widget
-
Displays before/after images of listing changes.
-
Initially shows current listing only (history builds over time).
📆 COGS History Widget
-
Reverse-chronological list:
-
Start & End Dates
-
COGS value
-
Units sold in that period
-
📂 Categories & BSR Widget
Lists product’s categories and sub-categories with their Sales Rank.
👥 Customer Segmentation Widget
-
Pie chart of customer segments.
-
Uses criteria defined in Customer Segmentation settings.
🔁 Repeating vs One-Time Customers Widget
-
Pie chart: % of Repeat vs One-Time customers.
-
Clicking “Customers” → opens full Customer List.
-
⚠️ Reports lifetime values (ignores dashboard date range).
📦 Product Inventory Widget
Displays stock status & age profile:
-
In Stock / Inbound / Reserved / In Transit / Warehouse
-
Inventory Tied Cost (Local Stock × COGS)
-
Age Buckets: <90d, 91–180d, 181–270d, 271–365d, >365d
-
Sales Velocity (units/day)
-
Days of Inventory left
-
Recommended Reorder Date (based on restock lead time, MOQ, velocity, etc.)