How To Get Here?
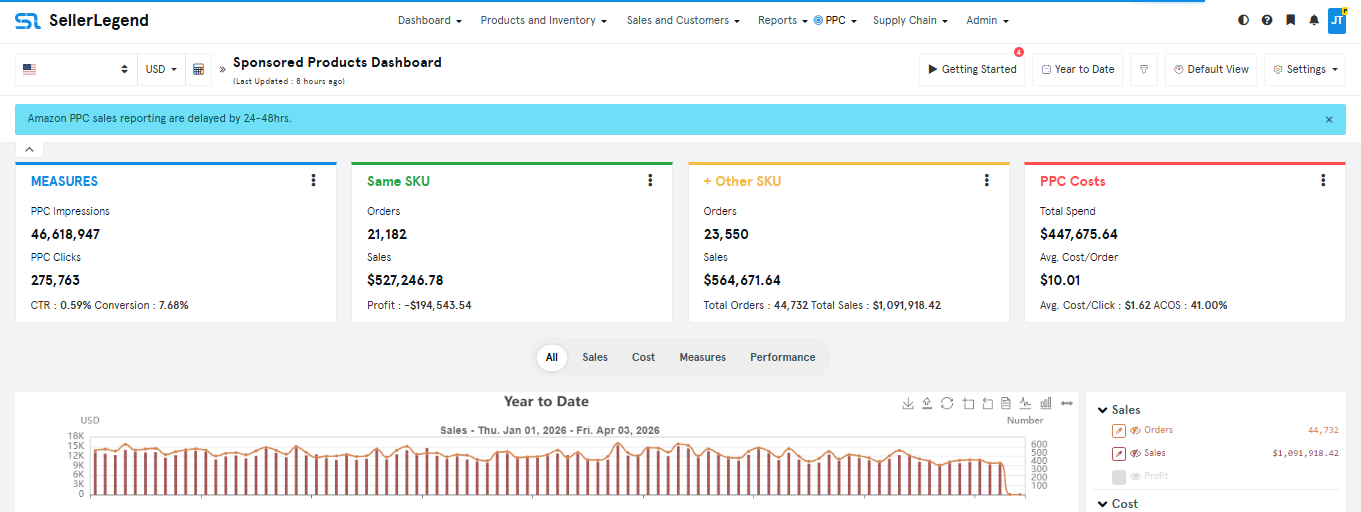
- Navigate to the Sponsored Products Dashboard by selecting PPC from the main menu located at the top of the screen.
What is it for?
- By clicking on the Date Range Selector, you can specify a range of dates and use the Sponsored Products Dashboard to quickly view the outcomes of your PPC campaigns, broken down by marketplace
- The data displayed on the Sponsored Products Dashboard is pertinent to a single marketplace and is presented in the selected currency.
- In case you possess multiple Accounts/Marketplaces, you can choose the desired one by selecting the corresponding option from the Marketplace Selector located at the top left of the screen.
Screen Print
Content
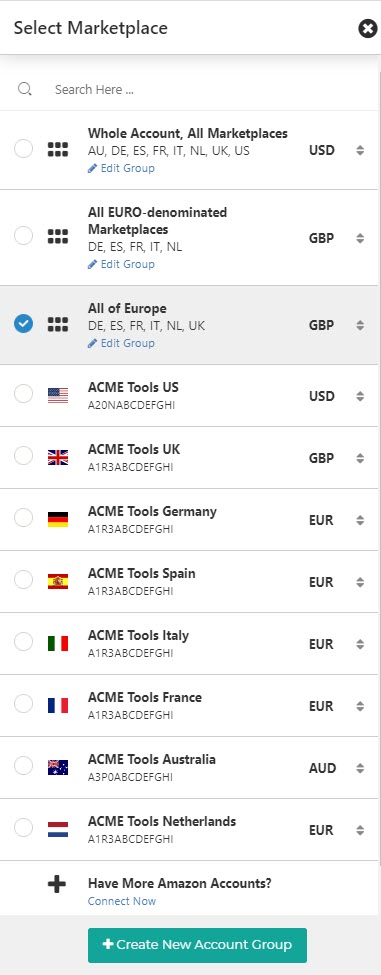
- Dashboard Marketplace Selector Panel
- When clicking on the marketplace selector, the following panel will appear
- Use this panel to select which Marketplace show on the dashboard.
- As a reminder, you can learn about selecting/switching Marketplaces or Groups here
- Tiled Key Performance Indicators Boards
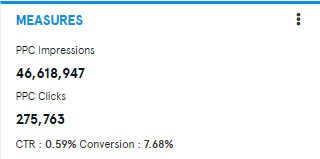
- Measures
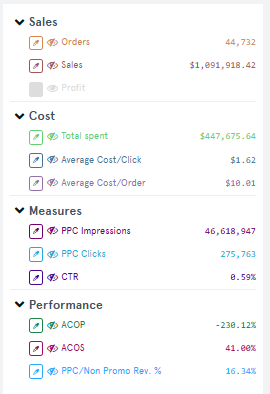
- Displays the number of
- PPC Impressions –The number of times your product ad was displayed, for a search query that matched the keywords you are running ads for.
- PPC Clicks – The number of times shoppers clicked on your product ad to view the complete product detail page.
- Click Through Rate – Expanded as Click through Rate, is the ratio of the Impressions versus the clicks, i.e. the number of times your advertisement was clicked by a shopper, for each time your ad was displayed.
- and Conversion – The conversion rate is the number of people who visited your listing versus the number of people who purchased your product.) for a chosen date range and Marketplace.
- Displays the number of
- Same SKU
- Displays the orders and Sales for the Same SKU: The SKU or product that was associated with the original advert that was clicked.
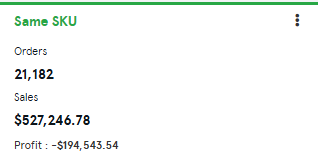
- Displays the orders and Sales for the Same SKU: The SKU or product that was associated with the original advert that was clicked.
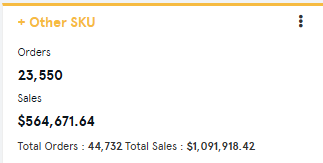
- Other SKU
- Displays orders and Sales for the Other SKU: If a user has clicked on an advert for one of your SKUs but then purchased another of your SKUs. e.g. if you are selling blue and red shirts, a user clicks on an advert for a red shirt but purchases a blue shirt, this is classed as an “Other SKU”.
- Shows aggregated revenue and number of orders, which include both the same SKU and other SKUs.
- PPC Cost
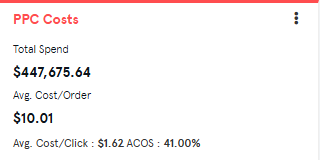
- Total PPC Spend : The total amount spent on your pay-per-click (PPC) advertising campaigns.
- Average Cost per Order (ACo) : The average advertising cost for each order generated through your ads.
- Average Cost per Click (CPC) : The average amount you’re charged each time a customer clicks on your ad.
- ACoS (Advertising Cost of Sale) : A key metric used to measure the effectiveness of your ad campaigns.
ACoS is calculated by dividing your total ad spend by the total ad revenue generated, then converting the result into a percentage.
ACoS=(Ad Revenue / Ad Spend)×100Example:
If you spent $50 on an ad campaign and generated $100 in sales from that campaign, your ACoS would be 50% .
- Measures
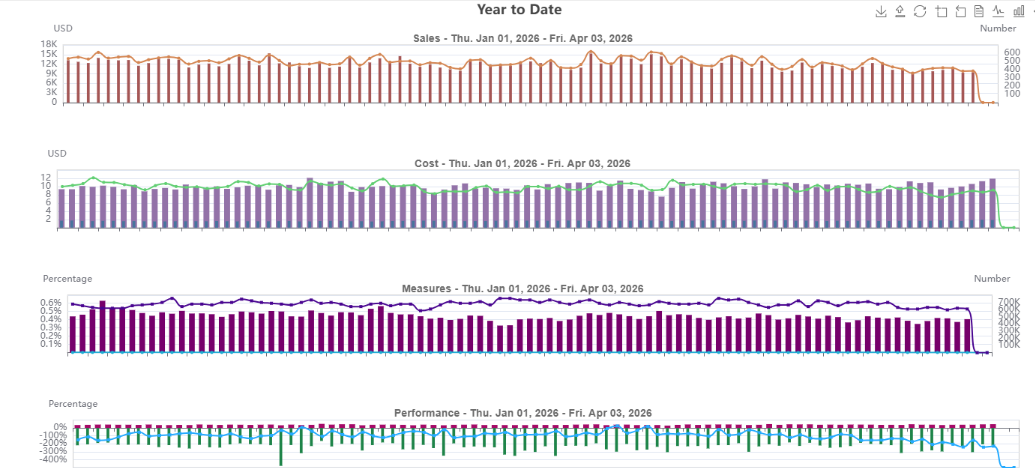
- The PPC History Bar Chart
 Sales
Sales
-
- Bar chart for PPC sales, orders and profit for a selected date range for each day.
- Cost
- Bar chart for total spend, Average Cost/Click, and Average Cost/Order for a selected date range for each day.
- Measures
- Bar chart for PPC Impressions, PPC Clicks, and Click Through Rate(CTR) for a selected date range for each day.
- Performance
- Bar chart for Advertising Cost of Sales-ACOS (Ads Spent / Sales ), Advertising Cost of Profit – ACOP (Profit / Ads Cost), and PPC/Non-Promo Rev % for a selected date range for each day. Revenue values to determine the ratio PPC/Non-Promo Rev. % are taken from the Sales per day per product report whereas PPC sales are from Sponsored Product dashboard
-
- The PPC History Chart Legend
- Sponsored Product Campaigns
 Content
-
- Action
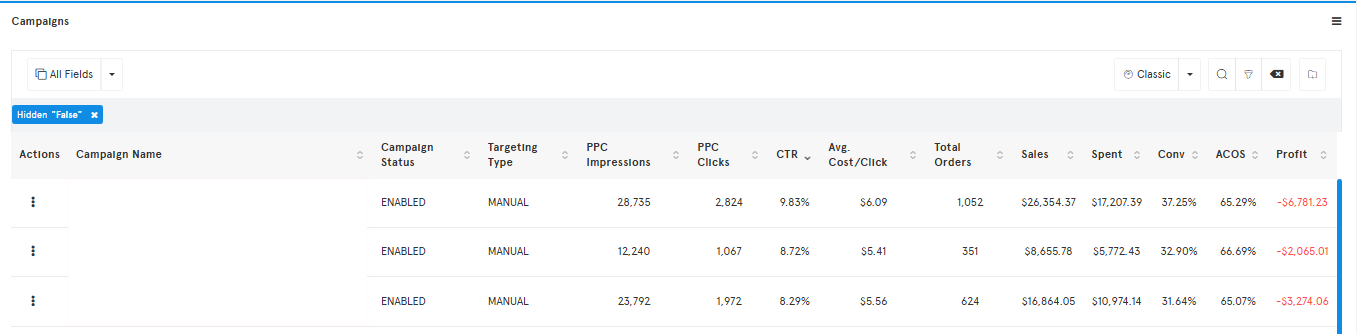
- Clicking on the action button allows for the hiding of a campaign.
- Campaign Name
- Name of the Campaign
- Campaign Status
- Status of Campaign
- Archived
- Enabled
- Pause
- Status of Campaign
- Targeting Type
- Auto
- Manual
- PPC Impression
- The number of times your product ad was displayed, for a search query that matched the keywords you are running ads for.
- PPC Clicks
- The number of times shoppers clicked on your product ad to view the complete product detail page.
- CRT
- Expanded as Click through Rate, is the ratio of the Impressions versus the clicks, ie the number of times your advertisement was clicked by a shopper, for each time your ad was displayed.
- Avg Cost/Click
- The average amount you’ve been charged for your Amazon product ad. Average cost-per-click (Avg. CPC) is calculated by dividing the total cost of your clicks by the total number of clicks.
- Total orders
- The overall quantity of orders generated by the campaign.
- Sales
- The revenue generated by the campaign.
- Spent
- The cost incurred for the campaign’s PPC advertising.
- Conversion
- The conversion rate is the number of people who visited your listing versus the number of people who purchased your product.
- ACoS
- Expanded as Advertising Cost of Sales, ACoS is the ratio of ad spend to the sales conversion generated from the ads. ACoS = ad spends ÷ sales
- Profit
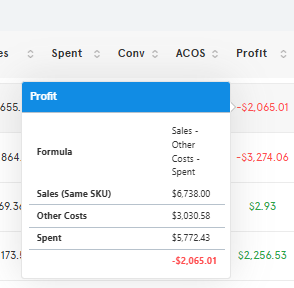
- Profit Earned Through PPC = Sales Amount Through PPC – ( Number of Units Sold through PPC * Other Cost ((Cost of Goods + Amazon FBA Fees)) – Amount Spent On PPC.
- By hovering over the profit number, a breakdown will be displayed.
- Action
-
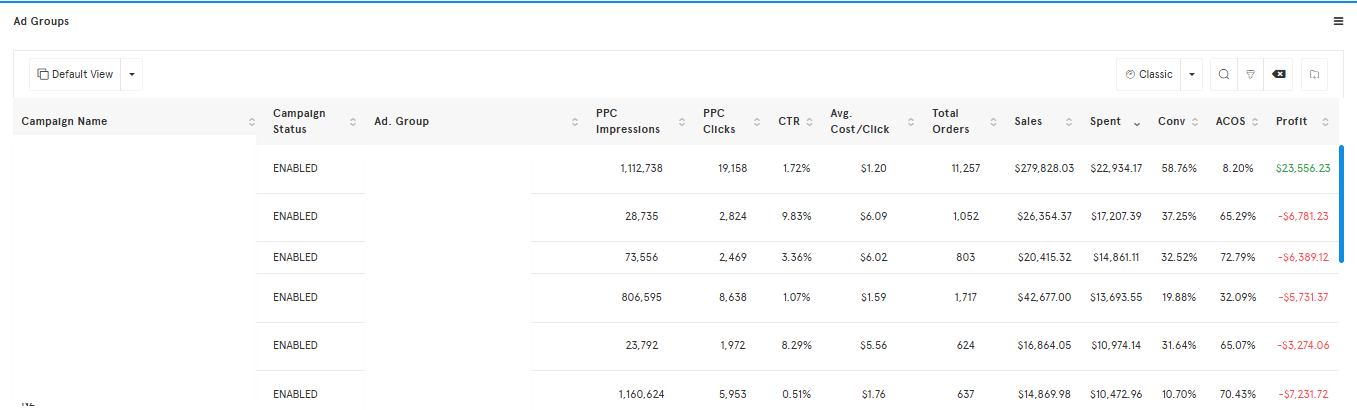
- Sponsored Product Ad Groups
- The advertising group that corresponds to each campaign.
- The definition of each column is identical to the one mentioned above in the campaign section.